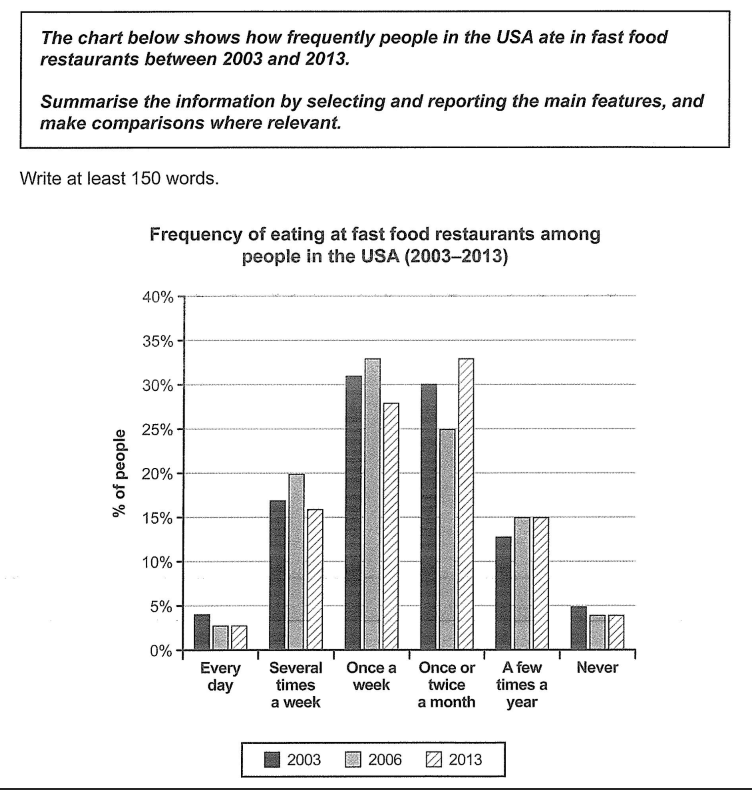
The chart below shows how frequently people in the USA ate in fast-food restaurants between 2003 and 2013.
Summarize the information by selecting and reporting the main features, and make comparisons where relevant.

The chart gives a breakdown of how frequently people ate in fast food restaurants in the US in three years, 2003, 2006, and 2013. Overall, it is clear that majority of Americans had marginally cut down on fast food meals by 2013.
In 2003, almost one-fifth of Americans ate fast food very frequently, with 4% of them consuming it daily.
Over sixty percent ate fast food weekly or monthly while less than 15% had fast food for only a few times a year. Finally, 5% of Americans never tasted the food in that year.
In 2006, the rate for frequent meals in fast food restaurants rose minimally, with one-fifth of Americans having fast food several times a week. The figure for those who ate fast food weekly peaked at 34% while the rate for “once or twice a month” decreased by 5 percent. Almost one-fifth of Americans consumed fast food very much less frequently.
By 2013, the rates for several times and once a week group had fallen by 4 and 2 percent respectively. Whereas the rate for once or twice a month reached its peak, at 32 percent, the remaining groups’ rate remained unchanged.
(197 words)

Band 8 sample answer by Mahdi Modarres
#writing #task1 #Ielts #Ieltsmodarres #modarres #cambridge #academic #chart #barchart #fastfood