The first chart below shows how energy is used in an average Australian household. The second chart shows the greenhouse gas emissions which result from this energy use.
Summarise the information by selecting and reporting the main features, and make comparisons when relevant.
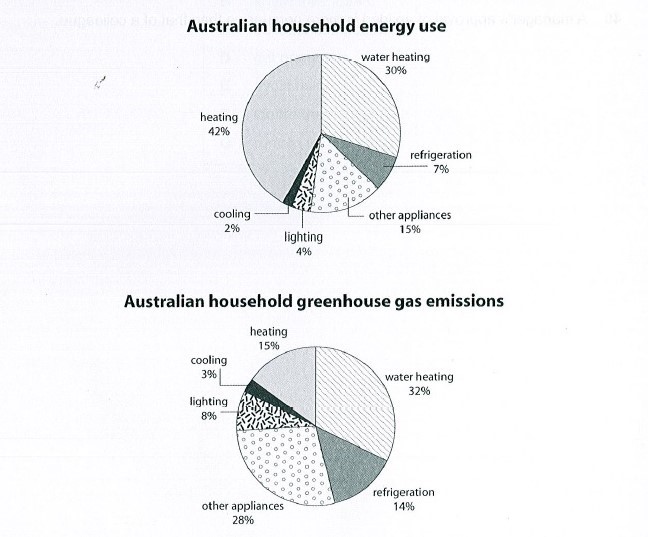
The pie charts give a breakdown of the energy use proportions in a typical Australian household and how much greenhouse gas is emitted as a result of the energy used.
Less than half of total energy use (43%) goes to heating. This rate is immediately followed by another 30% for heating water while “other appliances” in the house consume half as much. Refrigeration, lighting, and cooling account for the remaining 13% of household energy consumption collectively.
On the other hand, heating water and use of other appliances are responsible for the biggest share of the greenhouse gas emitted, almost two-thirds of total emissions, at 32 and 28 percent respectively.
Refrigeration and heating emit almost equal amounts and together produce almost one-third of all emissions while cooling (3%) and lighting (8%) contribute minimally to the process.
Overall, it is clear that heating, water heating, and other appliances constitute the greatest shares of energy use and subsequent greenhouse gas emissions whereas cooling and lighting contribute minimally to either.
Band 7 sample answer by Mahdi Modarres
#writing #task1 #Ielts #Ieltsmodarres #modarres #cambridge